Visual Code IDE側の作業1
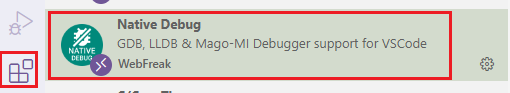
まず、Visual CodeのIntegrated Development Environment(統合開発環境)、以後Visual Code IDEにて「Extensions(Ctrl + Shift + X)」アイコンを選択して「Native Debug」拡張モジュールを見つけ、インストールします。
「Visual Code > Run > Add Configuration」を選択すると次のようなダイアログボックスが表示されます。
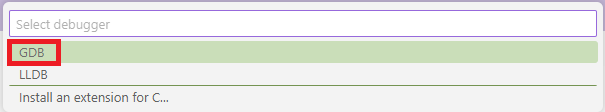
C++(GDB/LLDB)を選択しますと、次のような「.vscode > launch.json」ファイルを作成されます。
.vscode > launch.json
{
    // Use IntelliSense to learn about possible attributes.
    // Hover to view descriptions of existing attributes.
    // For more information, visit: https://go.microsoft.com/fwlink/?linkid=830387
    "version": "0.2.0",
    "configurations": [
        {
            "name": "Debug",
            "type": "gdb",
            "request": "launch",
            "target": "./bin/executable",
            "cwd": "${workspaceRoot}",
            "valuesFormatting": "parseText"
        }
    ]
}このファイルが開いた状態でもう一度「Visual Code > Run > Add Configuration」メニューを選択すると次のようなドロップダウンリストが表示されます。
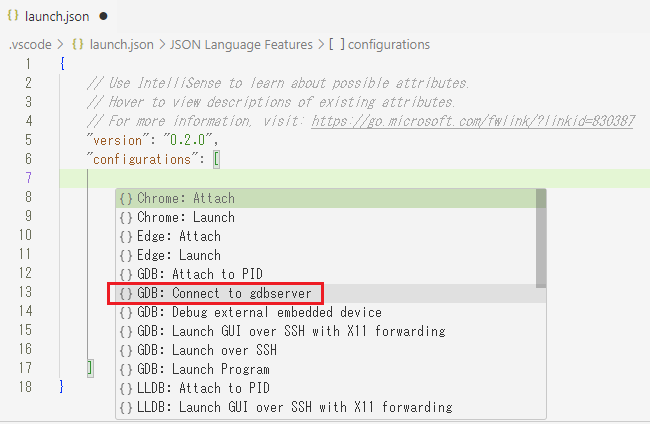
「{} GDB: Connect to gdbserver」を選択しますと次のような内容が自動でセットされます。
.vscode > launch.json
{
    // Use IntelliSense to learn about possible attributes.
    // Hover to view descriptions of existing attributes.
    // For more information, visit: https://go.microsoft.com/fwlink/?linkid=830387
    "version": "0.2.0",
    "configurations": [
        {
            "type": "gdb",
            "request": "attach",
            "name": "Attach to gdbserver",
            "executable": "./bin/executable",
            "target": ":2345",
            "remote": true,
            "cwd": "${workspaceRoot}",
            "valuesFormatting": "parseText"
        }
    ]
}
これを次のようにgdbserverを用いたデバッグ設定に変更します。
.vscode > launch.json
{
    "version": "0.2.0",
    "configurations": [
        {
            "name": "Attach to gdbserver",
            "type": "gdb",
            "request": "attach",
            "executable": "/home/myuser/hello",
            "target": "192.168.1.100:2345",
            "remote": true,
            "cwd": "${workspaceRoot}",
            "valuesFormatting": "parseText",
            "debugger_args": [],
            "stopAtConnect": true,
            "pathSubstitutions": {
                "/home/myuser/src/common": "/tmp/src/common",
                "/home/myuser/src/sqllib": "/tmp/src/sqllib"
            },
            "env": {
                "_CRT_SECURE_NO_WARNINGS": ""
            }
        }
     ]
}
プログラム実行マシン側の手順
gdbserverパッケージをインストールします。
# dnf search gdbserver
# dnf install gdb-gdbserver.x86_64
ファイアウォールが起動中の場合、gdbserver用portへのアクセスを許可します。
[root@localhost ~]# systemctl status firewalld
● firewalld.service - firewalld - dynamic firewall daemon
     Loaded: loaded (/usr/lib/systemd/system/firewalld.service; enabled; preset: enabled)
     Active: active (running) since Fri 2024-07-26 11:45:30 JST; 2h 50min ago
       Docs: man:firewalld(1)
   Main PID: 843 (firewalld)
      Tasks: 2 (limit: 48164)
     Memory: 43.5M
        CPU: 371ms
     CGroup: /system.slice/firewalld.service
             └─843 /usr/bin/python3 -s /usr/sbin/firewalld --nofork --nopid

 7月 26 11:45:29 localhost systemd[1]: Starting firewalld - dynamic firewall daemon...
 7月 26 11:45:30 localhost systemd[1]: Started firewalld - dynamic firewall daemon.
[root@localhost ~]# firewall-cmd --add-port=2345/tcp --zone=public --permanent
success
[root@localhost ~]# firewall-cmd --reload
success
[root@localhost ~]# firewall-cmd --list-all
public (active)
  target: default
  icmp-block-inversion: no
  interfaces: eth0
  sources:
  services: cockpit dhcpv6-client ssh
  ports: 2345/tcp
  protocols:
  forward: yes
  masquerade: no
  forward-ports:
  source-ports:
  icmp-blocks:
  rich rules:
次のように実行モジュールをgdbserverを用いて起動じます。
# gdbserver 192.168.1.100:2345 /home/myuser/hello p1 p2 p3
Process /home/myuser/hello created; pid = 390472
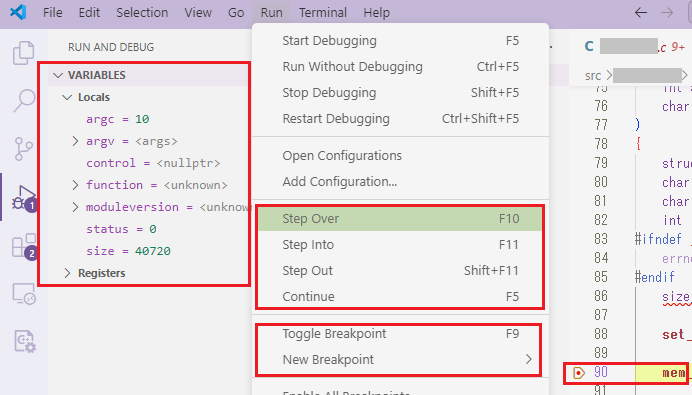
Listening on port 2345Visual Code IDE側の作業
Visual Code IDEにてデバッグするソースにブレークポイントを指定して「Visual Code > Run > Start Debugging」を選択します。以下の画面ようにStep Overでデバッグできるようになります。